The Financing of Local Government in China: Stimulus Loans Wane and Shadow Banking Waxes
The shadow banking activities in China surged in 2012-2013. Prof. Zhuo Chen and Prof. Chun Liu from Tsinghua University, Prof. Zhiguo He from Chicago Booth and Prof. Jinyu Liu from the University of International Business and Economics provide empirical evidence showing that the “barbarian growth” of China’s shadow banking during this period constitute a “hangover effect” from the four trillion RMB stimulus package in 2009.
An emergent branch of literature has documented China’s rapidly growing shadow banking activities, which includes wealth management products (WMP) and trust/entrusted loans. Hachem and Song (2017) highlight the asymmetric competition between the Big Four banks and their smaller competitors in China, and they attribute the formation of shadow banking as an unintended consequence of stricter liquidity regulations. Acharya et al. (2016) show that WMP issuance rose along with the massive stimulus plan in 2009, with greater increases among small and medium-sized banks, which face fierce competition from the local branches of big banks in attracting household deposits. Chen et al. (2016) document commercial banks’ engagement in intermediating entrusted loans and the various incentives of small and large banks in providing this service.
The literature thus far, however, has focused predominantly on the causes and impending consequences of burgeoning shadow banking activities around 2007-2009 in China, while ignoring the unprecedented wave of “barbarian growth” around 2012-2013. As shown in Figure 1, the increase of WMPs as a percentage of GDP was mild between 2005 and 2011 with an average growth rate of only 1.7%. But this dramatically picked up in 2012-2013, leading to soaring growth rates that ranged from 4.6% to 12.4% in the following years. The increase in new entrusted and trusted loans over GDP shows a similar pattern during this period.In this article, we argue that the surging shadow banking activities starting in 2012 constitute a “hangover effect” from the four trillion RMB stimulus package in 2009. This plan was aimed at combating the Great Recession that followed the global financial crisis of 2007-2008. Although successful in boosting the slumping Chinese economy in 2009 (i.e., effective in the short-run), the aggressive stimulus package has led to mounting pressure on local governments to refinance or rollover their bank debt in recent years, as this debt has begun to come due. Therefore, the stimulus foreshadowed many unintended long-term consequences, one of which is the rapid growth of shadow banking in China.
New Trusted/Entrusted Loans and Increase in WMP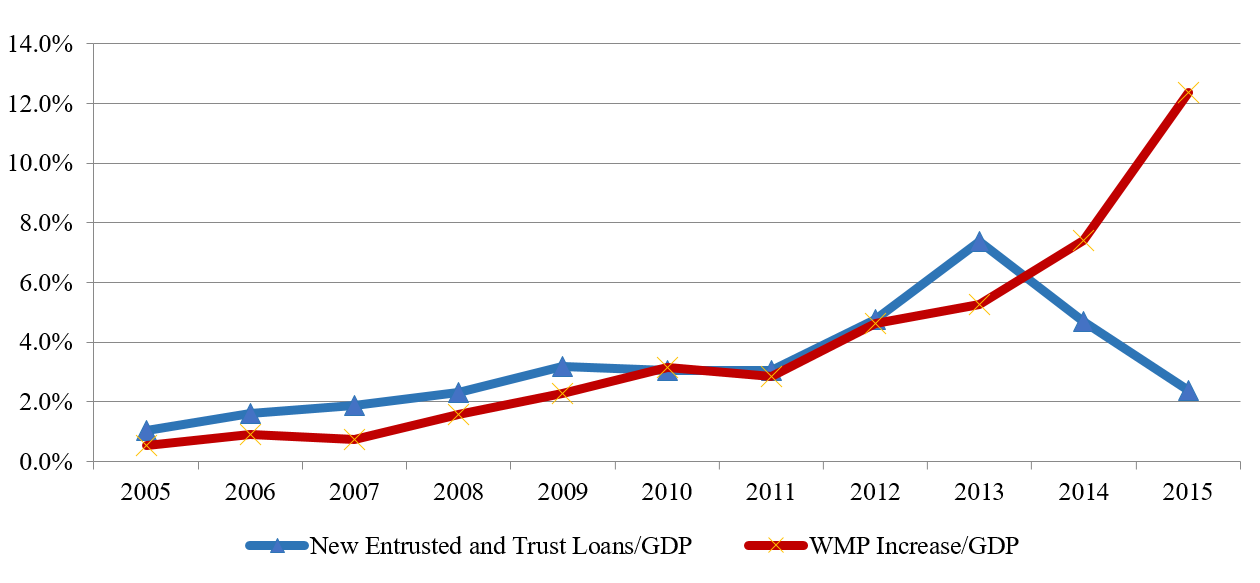
In the literature, Bai et al. (2016) document that the stimulus was implemented through local governments, which finance infrastructure investment through bank loans via off-balance-sheet Local Government Financing Vehicles (LGFVs). They argue that local governments may have facilitated access to capital to favored firms, worsening the overall efficiency of capital allocation and establishing a potentially permanent decline in the growth rate of China’s aggregate productivity and GDP growth.
Our research focuses instead on the liability side of the stimulus plan. Specifically, given the swollen debt burden of local governments beginning in 2009, and because bank loans often have three- to five-year maturities, the pressure to refinance bank debt emerged in 2012. Meanwhile, China’s credit policy reverted back to normal in 2010. This relatively stricter credit policy compelled local government resort to other financing sources in order to repay their massive stimulus bank loans. Additionally, LGFVs were compelled to continue financing the long-term infrastructure investments they undertook in 2009, thus fueling the need for shadow-banking financing in later years. These two forces constitute the “stimulus-loan-hangover” effect that pushed local governments towards non-bank debt financing after 2012.
Most of the sources of non-bank debt financing are related to trust and/or wealth management products—two off-balance-sheet items that are often regarded as the barometers of the shadow banking activities in China. The stimulus-loan-hangover effect is evident in the noticeable shifting of China’s local government financing away from (mainly) bank loans in 2009 and towards a significant fraction of non-bank debt starting in 2012. This view is also consistent with the post-2012 rapid growth of trust/entrusted loans as reported in “Aggregate Financing to the Real Economy” by China’s central bank. We show that areas with more aggressive 2009 bank-loan-fueled stimulus are issuing, in later years, more municipal corporate bonds, which are an important financing channel for local governments in China.
The Stimulus Package, Local Government Debt, and a Shift in Composition
Bai et. al (2016) document the close connection between the 2009 stimulus package and the rise of local government debt thereafter in China. Because the major component of the stimulus package is infrastructure projects, almost all investment spending is implemented and financed through local governments. Beijing only provided one fourth of the four trillion RMB in stimulus funding, however, implying that local governments faced a financing gap of up to 3 trillion RMB.
According to the 1994 national budget law, local governments are prohibited from borrowing from banks. To solve this dilemma, Beijing decided to circumvent the 1994 budget law and encourage local governments to borrow via their LGFVs, which are an important group of state-owned enterprises (SOEs) in China. As a result, bank loans soared in 2009, accounting for up to 90% of new local government debt during the recession. Several years later, the consequences of these debt obligations surfaced. In the second half of 2010, the country’s expansive credit policy returned to its normal level, evidenced by the decrease in new bank loans (plotted together with China’s GDP over the period of 2004-2015 in Figure 2).
New Bank Loan and GDP, 2004-2015 (2004 Fixed Price)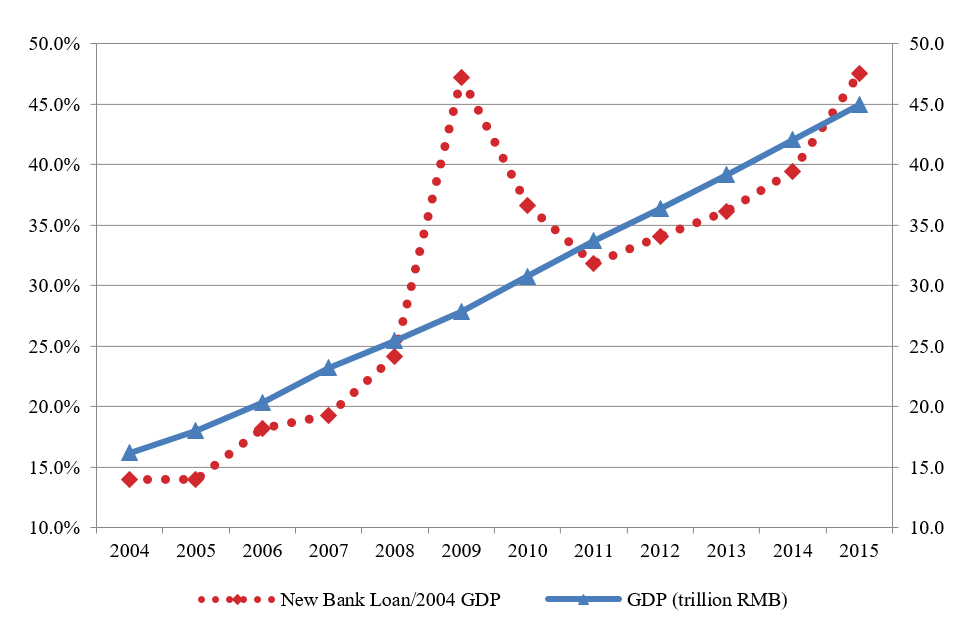
Local governments then resorted to non-bank financing either to continue their long-term infrastructure projects or to refinance/rollover their maturing bank loans. These non-bank financing sources include trust/entrusted loans and municipal corporate bonds . We focus our research, in part, on municipal corporate bonds, which are public bonds issued by LGFVs that come with the added safety of municipal bonds thanks to implicit guarantees from corresponding local governments.
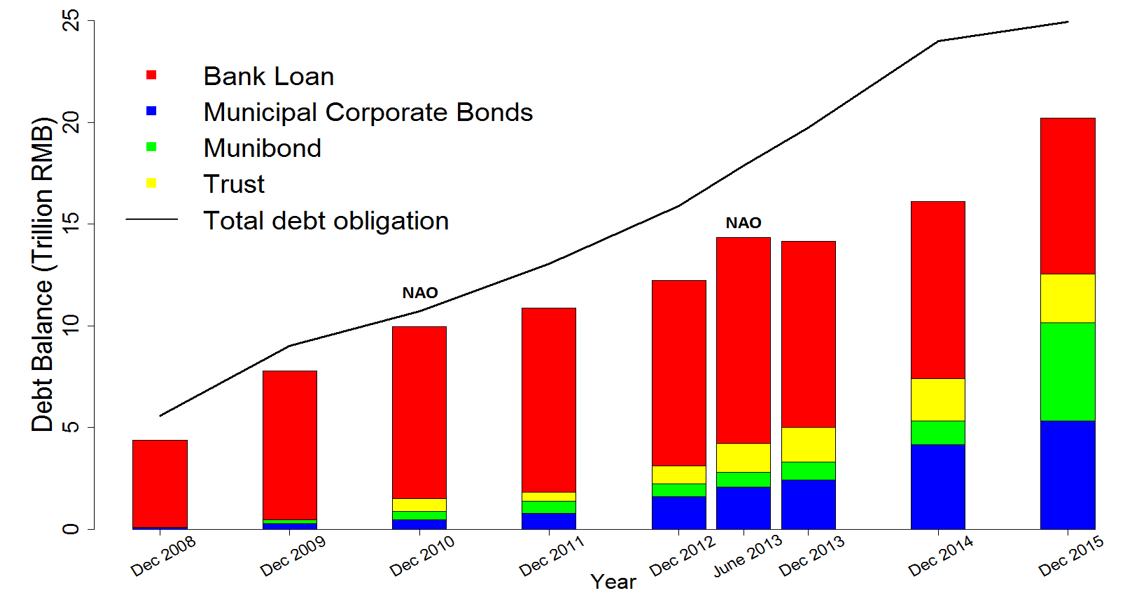
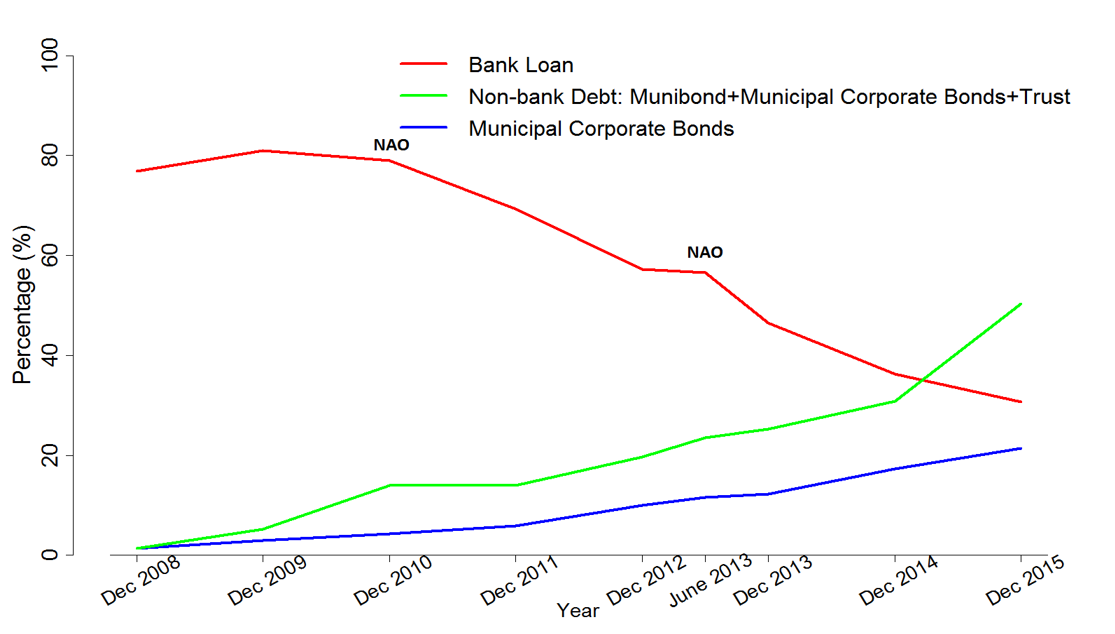
To get a flavor of the debt financing composition change during this period, we look into two comprehensive and authoritative surveys conducted by the National Audit Office in December 2010 and June 2013. These two reports offer snapshots of four different kinds of debt that reside on the liability side of local governments’ balance sheets: bank loans, which are bank debt, munibonds , municipal corporate bonds, and trust/entrusted loans. The latter three constitute non-bank debt. Figure 3 shows the gradual and noticeable composition shift from bank loans to non-bank debt, with the evolution of total local government debt balances and composition (Panel A), and the evolution of the percentage for each category (Panel B). We observe steady growth in local government non-bank debt as a fraction of total local government debt in China, rising from a negligible 1.4% in 2008 to 30.9% in 2014 and 50.3% in 2015.
Evidence from Municipal Corporate Bonds
In Figure 4, we show supportive evidence that LGFVs have aggressively issued municipal corporate bonds either to fund their continuing investments or to refinance bank loans coming due. Thanks to the reporting requirement for publicly traded bonds, we group the issuance purpose into three general categories: investment, repayment, and other (e.g., replenishing working capital). Figure 4 plots the time-series of each category over the period from 2008 to 2015. We observe that, in the first two years after the stimulus (2009 and 2010), almost all municipal corporate bond issuances were for investment; this includes the follow-up investment of long-term infrastructure projects, which continued to grow after 2012. What is more interesting is that repayment-driven municipal corporate bond issuance has gathered momentum since 2012. It reached about a quarter of total municipal corporate bond issuances in 2013 and experienced skyrocketing growth afterwards. In 2015, almost half of municipal corporate bond issuance deals were for the repayment of maturing bank loans.
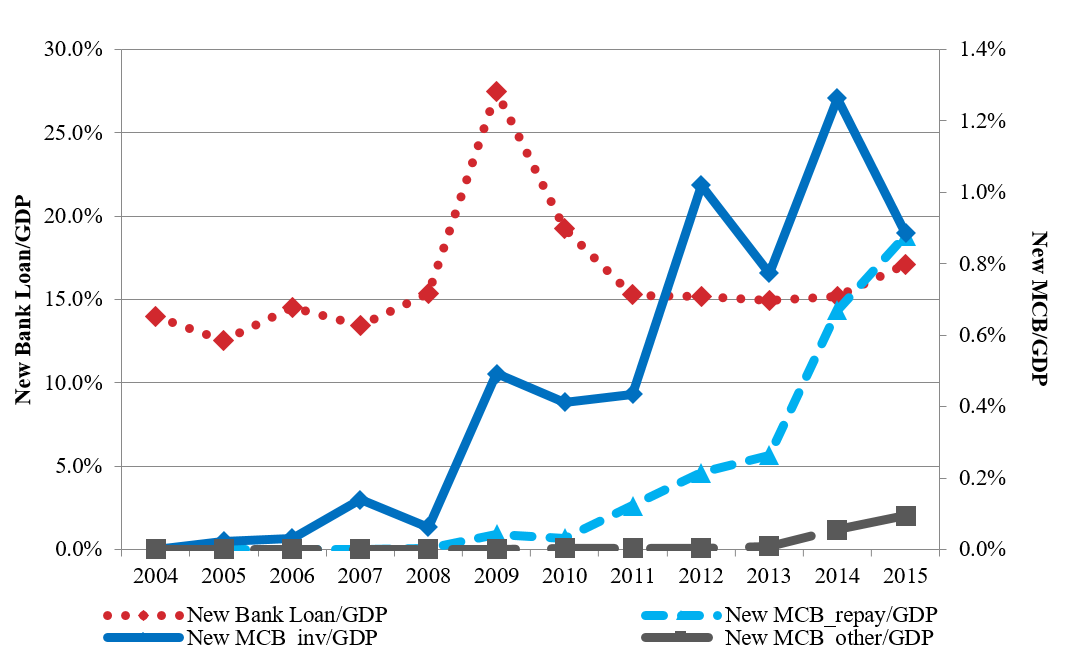
We provide further cross-sectional evidence to corroborate the stimulus loan hangover effect hypothesis. According to this hypothesis, the areas with more bank-loan-fueled stimulus in 2009, whether demand-driven or supply-driven, have more municipal corporate bond issuances several years later, as an after-effect of the stimulus package. To test this prediction, we regress the “abnormal” municipal corporate bond over GDP in 2012-2015 on the “abnormal” bank loan over GDP in 2009, where “abnormal” refers to the value of that variable minus its corresponding average over 2004-2008. We find that the 2009 abnormal bank loan positively predicts the abnormal municipal corporate bond issuance in that province, with 1% level significance in both 2013 and 2014, and 10% level significance in 2015. The evidence is robust at both the regional and provincial levels and with relevant controls (e.g., controlling for provincial GDP growth in later years). In terms of economic magnitude, we find that one more dollar of bank loans in 2009 leads to about 26 cents of municipal corporate bond issuance every year to repay bank loans, implying a roughly four-year-maturity of bank loans. This estimator squares well with the anecdotal evidence that stimulus loans often have three- to five-year maturities (Kroeber 2016).
Connection to Shadow Banking Growth after 2012
The shifting of local government liability towards non-bank debt is closely connected to the “barbarian growth” of shadow banking activities in China starting 2012. Local government non-bank debt is the sum of municipal corporate bonds, munibonds, and trusts in Figure 4. And a good proxy for shadow banking activities in China is the sum of three items in the table of “Aggregate Financing to the Real Economy” published by People’s Bank of China: trust/entrusted loans, corporate bonds (to which municipal corporate bonds belong), and undiscounted bankers' acceptances (a relatively small item). There is steady growth in local government non-bank debt as a fraction of shadow banking activities in China, rising from 1.5% in 2008 to 22.3% in 2014 and then to 34.1% in 2015.
We present yet another important fact that is often neglected by academic researchers, namely that the majority of municipal corporate bonds are invested by WMPs—the most important form of shadow banking activity in China. Based on the China Banking Wealth Management Registration System, we estimate that about 40% of municipal corporate bonds were held by WMPs at the end of 2014; this fraction rose to about 62% in 2016. These numbers likely represent a severe underestimation of the extent to which WMPs are investing in municipal corporate bonds. It is a common practice for WMPs (raised by some small banks) to invest funds in trusts, which in turn lend the money to a bigger bank that eventually invests in municipal corporate bonds. From the way the statistics are reported in the Annual Report, this indirect exposure of WMP in municipal corporate bonds is not reflected in the WMP's exposure to credit bonds (indicating a downward bias in our estimate). Anecdotally, a trader in one of the biggest banks in China estimates that about 70% of municipal corporate bonds are invested by WMPs.
Finally, we present the same cross-sectional evidence of waning bank loans and waxing shadow banking when stepping outside the box of local governments. The provinces with more bank-loan-fueled stimulus in 2009 show greater entrusted loan growth starting in 2012, consistent with the hypothesis that the rampant growth of shadow banking activities in China are one of the unintended consequences of the stimulus package in 2009.
Conclusion
Our paper paints a broad picture that connects the 2007-2008 financial crisis in the U.S., the 2009 four trillion RMB stimulus package in China, and the surging shadow banking system in China after 2012. We argue that the “barbarian growth” of shadow banking in China after 2012 is partly driven by the mounting pressure that LGFVs faced to finance continuing investment or to repay maturing 2009 stimulus loans about three to five years later. The stimulus-loan-hangover effect has also impacted the way the Chinese government has regulated financial markets and enforced regulations. For instance, in 2010 the strict enforcement of regulations on LGFVs successfully restrained municipal corporate bond issuances. In contrast, as local governments faced mounting rollover pressure, regulators proposed conflicting rules in 2014 which intentionally enabled LGFVs to borrow from the municipal corporate bonds market again. This evidence highlights the power of market forces in shaping regulation in China, which gradually becomes endogenous in later years. Furthermore, this particular market force is perhaps also responsible for the rapid growth of the interbank market, as well as the other two important milestones of recent banking reform in China: the finalization of interest rate liberalization featuring the removal of all limits on lending rates in 2013 and the removal of all limits on deposit rates in 2015, and the introduction of the deposit insurance scheme in 2015.
(Zhuo Chen, PBC School of Finance, Tsinghua University; Zhiguo He, Booth School of Business, University of Chicago; Chun Liu, School of Economics and Management, Tsinghua University; Jinyu Liu, School of Banking and Finance, University of International Business and Economics.)
Acharya, V Viral, Jun Qian, and Zhishu Yang (2016), “In the shadow of banks: wealth management products and issuing banks’ risk in China,” Working paper, NYU Stern.
Bai, Chong-En, Chang-Tai Hsieh, and Zheng (Michael) Song (2016), “The long shadow of a fiscal expansion,” Brookings Papers on Economic Activity, 60, 309–327.
Chen, Kaiji, Jue Ren, and Tao Zha (2016), “What we learn from China’s rising shadow banking: Exploring the nexus of monetary tightening and banks’ role in entrusted lending,” Working paper, Emory University.
Chen, Zhuo, Zhiguo He, and Chun Liu (2017), “The Financing of Local Government in China: Stimulus Loan Wanes and Shadow Banking Waxes,” Working paper, Chicago Booth.
Hachem, Kinda, and Zheng (Michael) Song (2017), “Liquidity Regulation and Credit Booms: Theory and Evidence from China,” Working paper, Chicago Booth.
Kroeber, Arthur (2016), China’s Economy: What Everyone Needs to Know, Oxford University Press.

Latest
Most Popular
- VoxChina Covid-19 Forum (Second Edition): China’s Post-Lockdown Economic Recovery VoxChina, Apr 18, 2020
- China’s Joint Venture Policy and the International Transfer of Technology Kun Jiang, Wolfgang Keller, Larry D. Qiu, William Ridley, Feb 06, 2019
- China’s Great Housing Boom Kaiji Chen, Yi Wen, Oct 11, 2017
- Wealth Redistribution in the Chinese Stock Market: the Role of Bubbles and Crashes Li An, Jiangze Bian, Dong Lou, Donghui Shi, Jul 01, 2020
- The Dark Side of the Chinese Fiscal Stimulus: Evidence from Local Government Debt Yi Huang, Marco Pagano, Ugo Panizza, Jun 28, 2017
- What Is Special about China’s Housing Boom? Edward L. Glaeser, Wei Huang, Yueran Ma, Andrei Shleifer, Jun 20, 2017
- Privatization and Productivity in China Yuyu Chen, Mitsuru Igami, Masayuki Sawada, Mo Xiao, Jan 31, 2018
- How did China Move Up the Global Value Chains? Hiau Looi Kee, Heiwai Tang, Aug 30, 2017
- Evaluating Risk across Chinese Housing Markets Yongheng Deng, Joseph Gyourko, Jing Wu, Aug 02, 2017
- China’s Shadow Banking Sector: Wealth Management Products and Issuing Banks Viral V. Acharya, Jun Qian, Zhishu Yang, Aug 09, 2017


 Facebook
  Twitter
  Instagram
 WeChat
  Email
Email 


