Special Deals from Special Investors: The Rise of State-Connected Private Owners in China
We document a hierarchy of private owners connected to the state through equity investment and a rapid expansion of this hierarchy over the past two decades. We build a model to show how the effects of a special deal from a state investor can be transmitted and amplified through the hierarchy. Our estimation suggests that the expansion in the span of state-connected private owners may have increased aggregate output of the private sector by 4.2% a year between 2000 and 2019.

The gradual improvement of formal economic institutions has been viewed as a key driving force for the extraordinary economic growth in China over the last four decades. Our previous work (Bai et al., 2020a) contested that orthodox explanation. We argued that “special deals,” which is an informal institution available to private firms, underpin China’s economic success. The enormous administrative capacity of Chinese local governments, the high-powered incentives of local leaders, and the ferocious competition among local governments to attract businesses are the three main characteristics that distinguish China from many other developing countries, where special deals also prevailed but had little effect (if not a negative one) on economic growth.
A challenge for this narrative is that informal institutions, including special deals, are often locally effective, beneficial to a small group of people only and, hence, hard to substitute for formal institutions. Our new work (Bai et al., 2020b) documents a hierarchy of private owners through which the effects of special deals can be transmitted and amplified. Owners closer to the state undertake investment with those further from the state and extend the coverage of the informal institution to a significant proportion of private owners. Moreover, the network expanded rapidly over the last two decades. The share of connected private owners weighted by registered capital increased from 15.9% in 2000 to 35.4% in 2019.
Specifically, we use the firm registration records of the State Administration for Market Regulation. The registration records identify the immediate owners of each firm. The immediate owners can be individual persons or another firm. We focus on the ownership links between the ultimate owners. That is, we work through the ownership chain to identify each firm's ultimate owners, which can be state-owned firms, private individuals, foreign firms, or collective owners. We have access to the registration records in 2013 and 2019. We use the 2019 records to identify the ultimate owners (and their share of registered capital) of the active firms in that year. We then use the 2013 registration records and assume the immediate owners of a firm to be constant over time to identify the ultimate owners and their ownership stake in 2000 and 2010 (see Note 1).
We use the following definitions to characterize the hierarchy of private owners.
Distance to the State: The minimum number of other private owners between the private owner and the state. Private owners with a distance of 1 are those with joint ventures with state owners and referred to as directly connected private owners. Private owners with a distance above 1 are those whose only connection with a state owner is through a joint venture with another state-connected private owner, who is relatively closer to the state. They are referred to as indirectly connected private owners.
Downward Connections and Connected Investor: Consider two connected owners, A and B, that have a joint venture. If owner B is more distant from the state than owner A, then owner A has a “downward” connection with owner B. Owner A is also owner B's connected investor.
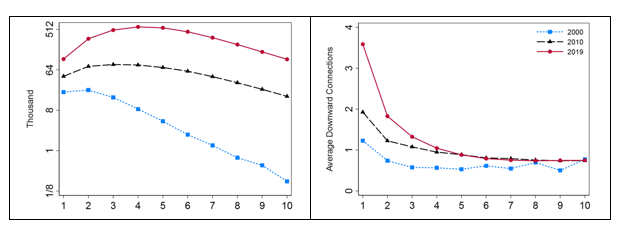
The left panel in Figure 1 shows that the number of directly connected private owners (distance = 1) increases by fivefold from 2000 to 2019, from 20,000 to more than 100,000. The panel also shows that the number of indirectly connected private owners increased dramatically. This effect is particularly dramatic for owners very distant from the state. The number of owners with a distance greater than 5 increased from around 5,000 in 2000 to more than 1.5 million by 2019. The huge increase in the number of indirectly connected owners is driven, in a proximate sense, by the significant increase in the number of private owners directly connected to the state and by the increase in the number of downward connections per private owner. The latter is shown in the right panel in Figure 1.
Figure 1: Expansion of Connected Private Owners, 2000–2019

Note: The x-axis is a private owner’s distance to the state.
The expansion of state-connected private owners played a key role in the expansion of China’s private sector in the past two decades. Column (1) of Table 1 shows that the share of private owners in total registered capital increased by 14.4 percentage points between 2000 and 2019. Strikingly, the share of all connected private owners, including directly and indirectly connected owners, increased by 19.5 percentage points between 2000 and 2019. In other words, the share of unconnected private owners dropped by 5.1%.
Table 1: Share of Connected Owners in Registered Capital, 2000–2019

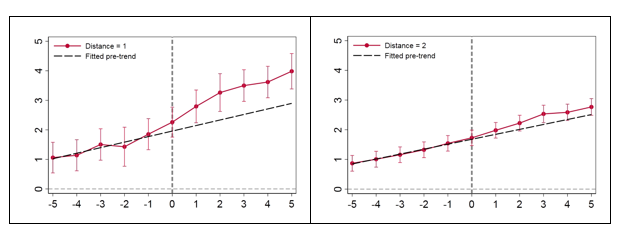
To measure the effect of becoming connected on a private owner, we conducted “event” studies. The left panel of Figure 2 shows the effect on the number of firms owned by the owners that were initially unconnected and became directly connected. The right panel shows the effect for the owners that were initially unconnected and became indirectly connected with a distance of 2. The reference group is the private owners who are never connected to the state. The coefficient estimates and the standard errors are shown in red; the black dashed line fits and extrapolates the pre-trend. The figure delivers three messages. First, there is clearly a pre-trend. We interpret this as saying that owners that were growing quickly are more likely to become connected. Second, there is a clear change in the trend once the owner becomes connected. Third, the magnitude of the change in the trend is larger for owners that become directly connected compared to owners that become indirectly connected. We found similar effects on the number of provinces and industries the owner operates in.
Figure 2: Effect of Becoming “Connected” for Private Owners

Note: The x-axis is the number of years relative to the year when the owner became connected (normalized to 0).
We built a model to formalize the formation of the hierarchy. We then structurally estimated the model and conducted counterfactual exercises. The first row of Table 2 shows the growth rate of private sector GDP in the data. Denote γd the benefits of being connected at distance to the state of d. The second row shows the effect of the change in γd for all d and the resulting expansion in the size of the connected sector on aggregate output growth. From 2000–2019, the expansion of the connected sector increased the aggregate growth rate by an average of 4.2% per year—almost half of the growth of the private sector in the data. The expansion of the connected sector raised the annual aggregate growth by 3.4 and 5.1 percentage points in 2000–2010 and 2010–2019, respectively.
Table 2: Aggregate Output Growth from Connected Investors, 2000–2019

The next two rows decompose the effect to the increase in benefits from state owners to private owners directly connected to the state versus the increase in benefits that private owners bestow on their partners. The change in γ1 alone contributes two-thirds and almost half of the growth effect in 2000–2010 and 2010–2019, respectively. To understand the surprisingly large effect of γ1, which only increased by two-thirds between 2000 and 2019, it is useful to conceptualize the multiplier effect of an additional connected owner implied by the hierarchy of owners. While a newly connected private owner may establish joint ventures with only a handful of additional private owners, these private owners in turn will also have joint ventures themselves with additional private owners, and so on. This leads to the multiplier effect.
The last two rows of the table show the effect of the contribution of the expansion of private owners directly connected to the state versus the expansion of private owners that are only indirectly connected to the state. The message here is that around 50% of the contribution of connected owners to growth comes from directly connected owners over this period, although the role of indirectly connected owners is larger in the last nine years. In summary, our quantitative exercise suggests that the expansion in the “span” of connected owners from these investments with private owners may have increased aggregate output of the private sector by 4.2% a year between 2000 and 2019.
An obvious caveat of this study is that the state-private connection is entirely based on equity ties. Unobservable but powerful connections could make some private owners be the connected investors and perhaps even more connected than the state-owned firms that they are linked with through equity. We think this is likely in many cases. It also raises the question of why connected individuals would choose to “share” their equity with official state owners when the latter are less politically connected. One explanation is that the equity ties with state-owned firms could give the connected owners cover to provide favors to these firms. We do not currently have a way of identifying such individuals, but this is something future research can address.
Note 1: We check the errors due to this assumption by comparing ownership in 2013 inferred from the 2019 data with the ownership measured directly from the 2013 data.
(Chong-En Bai, School of Economics and Management, Tsinghua University; Chang-Tai Hsieh, Booth School of Business, University of Chicago and NBER; Zheng Michael Song, Department of Economics, Chinese University of Hong Kong, Shatin, N.T., Hong Kong; Xin Wang, Department of Economics, Chinese University of Hong Kong, Shatin, N.T., Hong Kong.)
References
Bai, Chong-En, Chang-Tai Hsieh, and Zheng Michael Song. 2020a. “Special Deals with Chinese Characteristics.” NBER Macroeconomics Annual, 34(1): 341–379.
Bai, Chong-En, Chang-Tai Hsieh, Zheng Michael Song, and Xin Wang. 2020b. “Special Deals from Special Investors: The Rise of State-Connected Private Owners in China.” NBER Working Paper, No. w28170.

Latest
Most Popular
- VoxChina Covid-19 Forum (Second Edition): China’s Post-Lockdown Economic Recovery VoxChina, Apr 18, 2020
- China’s Joint Venture Policy and the International Transfer of Technology Kun Jiang, Wolfgang Keller, Larry D. Qiu, William Ridley, Feb 06, 2019
- China’s Great Housing Boom Kaiji Chen, Yi Wen, Oct 11, 2017
- Wealth Redistribution in the Chinese Stock Market: the Role of Bubbles and Crashes Li An, Jiangze Bian, Dong Lou, Donghui Shi, Jul 01, 2020
- The Dark Side of the Chinese Fiscal Stimulus: Evidence from Local Government Debt Yi Huang, Marco Pagano, Ugo Panizza, Jun 28, 2017
- What Is Special about China’s Housing Boom? Edward L. Glaeser, Wei Huang, Yueran Ma, Andrei Shleifer, Jun 20, 2017
- Privatization and Productivity in China Yuyu Chen, Mitsuru Igami, Masayuki Sawada, Mo Xiao, Jan 31, 2018
- How did China Move Up the Global Value Chains? Hiau Looi Kee, Heiwai Tang, Aug 30, 2017
- Evaluating Risk across Chinese Housing Markets Yongheng Deng, Joseph Gyourko, Jing Wu, Aug 02, 2017
- China’s Shadow Banking Sector: Wealth Management Products and Issuing Banks Viral V. Acharya, Jun Qian, Zhishu Yang, Aug 09, 2017


 Facebook
  Twitter
  Instagram
 WeChat
  Email
Email 


