A Bridge on Economic Issues between China and the World


 Facebook
  Twitter
  Instagram
 WeChat
  Email
Email Drive Down the Cost: Learning by Doing and Government Policies in the Global EV Battery Industry
Electric vehicle (EV) battery costs have fallen over 90% in the last decade. This study examines how learning-by-doing (LBD) drives this decline and interacts with government policies such as consumer EV subsidies and local content requirements. Leveraging rich data on EV models and battery suppliers from 13 countries with the largest EV sales, which account for 95% of global EV sales, we develop a structural model of the EV industry that incorporates consumer choices and pricing strategies by EV producers and battery suppliers. The model allows us to recover battery costs and measure the impact of LBD on cost reduction while controlling for technological progress, economies of scale, input costs, and EV assembly experience. We estimate a learning rate of 7.5%, which explains nearly 36% of battery cost reduction observed during 2013–2020. Consumer subsidies explain 45% of global EV sales during our data period, and LBD greatly amplifies the effectiveness of consumer EV subsidies by accelerating learning. Consumer EV subsidies in one country can generate global spillover benefits through shared battery suppliers. However, local content requirements on batteries inhibit the spillovers.
Electrifying transportation and transitioning to a cleaner grid are key strategies to mitigate climate change. To achieve these goals, many countries have set ambitious transportation electrification targets and implemented policies promoting electric vehicle (EV) adoption. Historically, high upfront EV costs—largely due to expensive lithium-ion batteries—were a major barrier to adoption. However, EV battery costs fell almost 90% between 2010 and 2020 (Bloomberg NEF, 2023). Industry experts attribute the reduction mainly to learning-by-doing (LBD), where production experience lowers unit costs by reducing scrap rates and improving efficiency. Technological progress and increased production scale may have also contributed to the cost reduction.
Despite the importance of battery costs in the diffusion of EV technology, there is a lack of credible causal evidence on the size and nature of LBD and a limited understanding of how LBD interacts with various government policies in the EV industry. This research has two objectives. First, it quantifies LBD and its contribution to the observed reduction in EV battery costs over time. Second, it assesses how LBD interacts with the two prominent classes of government policies—consumer subsidies and local content requirements (i.e., preferential treatments of domestic or local battery producers)—on domestic and global EV diffusion, market share dynamics, and social welfare.
Consumer subsidies have been widely adopted worldwide and amounted to $43 billion in 2022 (International Energy Agency, 2023). For example, the US Inflation Reduction Act (IRA) of 2022 offers subsidies of up to $7,500 per EV for eligible purchases, while China provided generous subsidies to EV buyers between 2010 and 2022. These subsidies drive higher EV adoption, which increases experience in battery production. LBD associated with the enhanced production experience reduces battery costs and EV prices. These cost reductions and lower EV prices, in turn, further accelerate EV adoption, amplifying the direct effects of consumer subsidies and other supportive policies.
From January 2016 to June 2019, China implemented a whitelist policy that restricted EV subsidies to vehicles using batteries from government-approved (domestic) producers. Figure 1 provides descriptive evidence of this policy’s impacts. Panel (a) depicts the share of EV models sourcing batteries from Chinese suppliers for those sold in China (solid red line, left y-axis) and outside China (dashed blue line, right y-axis). As intended, the share of EV sales in China that sourced batteries from Chinese suppliers rose from below 70% in 2016 to nearly 90% in 2019, then declined after the policy was lifted. Panel (b) shows that, during the whitelist period, the sales of BYD and CATL—China’s largest battery suppliers on the whitelist—grew significantly faster than those of the top four non-Chinese suppliers.
Similarly, to qualify for consumer subsidies, the US IRA mandates EV models to source a certain fraction (in terms of value) of critical minerals and battery components from firms in North America or free trade agreement partner countries. The US IRA is beyond our sample period, but we believe that the impacts of China’s whitelist policy we examine in this paper underscore the same underlying forces at play and can be informative for analyzing similar policies in other markets.
We utilize a comprehensive database on the global EV and battery industries, comprising three key components. The first dataset covers annual EV sales (2013–2020) in 13 countries, which together accounted for over 95% of global EV sales; it reports sales and vehicle and battery attributes by model and country for both battery EVs (BEVs) and plug-in hybrid EVs (PHEVs). The second dataset provides information on battery suppliers, including plant locations and the EV models they supply. The third dataset contains financial incentives for EV purchases in each country over time. Additionally, we collected socioeconomic variables and household surveys on vehicle ownership across countries.
Figure 1: China’s Whitelist Policy

Notes: The two dotted vertical lines depict the timing of China’s whitelist policy. Panel (a) shows the share of EV models sourcing from Chinese battery suppliers separately for EV models sold in China (red solid line, left y-axis) and those sold elsewhere (blue dashed line, right y-axis). Panel (b) shows the growth of (average) experience of battery suppliers over time separately for the top two Chinese suppliers (BYD and CATL) and the leading non-Chinese suppliers (AESC, Panasonic, LG, and Samsung).
LBD estimation relies on the relationship between production experience and battery costs. Panel (a) of Figure 2 illustrates changes in price residuals divided by battery capacity over time, after controlling for vehicle characteristics and a rich set of country, brand, and year fixed effects.
The blue dots represent the sales-weighted average annual price residuals per kWh. These residuals exhibit a substantial decline from 2014 to 2020, closely matching the trend in battery costs reported by Bloomberg NEF (2023), shown as red diamonds. Panel (b) presents a binned scatter plot of price residuals, with each dot representing a country-year-model. It reveals a strong and precisely estimated negative relationship between price residuals and supplier experience, indicating that EV models supplied by more experienced battery suppliers tend to have lower prices. Moreover, the production experience increases with cumulative subsidies received by the battery supplier (as reflected by the size of the dots), motivating the key LBD identification strategy.
Figure 2: Vehicle Price vs. Battery Supplier Experience
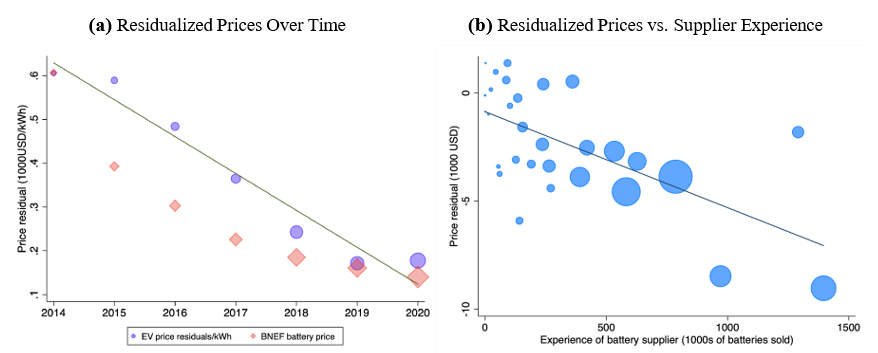
Notes: The residualized vehicle prices in these graphs are EV prices partialling out vehicle attributes (horsepower, size, and the PHEV dummy), and country, brand, and year fixed effects. In Panel (a), the price residuals are divided by battery capacity as a proxy for battery costs per kWh, and the purple dots depict the sales-weighted average annual price residuals per kWh (in $1000). The red diamonds are the average battery pack price from Bloomberg NEF (2023). The marker size is proportional to the total EV sales in a given year. The binned scatter plot in Panel (b) shows the residualized prices (in $1000) against the cumulative experience of battery suppliers. The size of the dots is proportional to the cumulative subsidy received by battery suppliers.
Estimating the extent of LBD entails addressing two key challenges. First, we do not observe systematic data on battery costs at the vehicle-model level, which are proprietary in nature. To address this challenge, we develop a framework of price-setting behaviors of battery suppliers and EV producers to infer upstream and downstream markups. This allows us to recover battery costs based on observed vehicle prices and estimated demand elasticity. We investigate and estimate a variety of supply-side models, including Nash-Bargaining (simultaneous vs. sequential) and linear pricing, with and without incorporating battery suppliers’ forward-looking behavior. We also validate our battery cost estimates using industry reports and trade data.
Second, firm experience (i.e., cumulative production) that underlies LBD is potentially endogenous and correlated with unobserved marginal cost shocks in battery production. We construct an instrument variable for battery supplier experience by leveraging demand shifters. Specifically, we exploit differences in suppliers’ exposure to downstream EV subsidies, which vary over time and across vehicle models sold in different countries. The intuition is that suppliers selling batteries to countries with more generous EV subsidies will accumulate experience faster than those selling in markets with lower subsidies. If LBD effects are present, battery costs for the former suppliers will decline more rapidly than for the latter group, ceteris paribus. Our IV also exploits the shock of China’s whitelist policy, which generated exogenous variation in production experience across battery suppliers. In addition, we control for a range of other confounding factors, including industry-wide technological progress.
Our empirical analysis delivers five key findings. First, the learning rate is estimated to be 7.5% after controlling for technological advancements, experience in EV assembly, input costs, and economies of scale. This implies that doubling battery production experience would reduce unit production costs by 7.5%. Although this learning rate is on the lower end of estimates reported for EV batteries and other technologies (e.g., Argote and Epple, 1990; Irwin and Klenow, 1994; Ziegler and Trancik, 2021; Covert and Sweeney, 2022), LBD alone accounted for a sizable 35.5% of the overall decline in battery costs from 2013 to 2020. Industry-wide technological progress was responsible for an additional 39.9% of the cost reduction, with the remainder explained by LBD in EV assembly, changes in battery chemistry, input cost fluctuations, and economies of scale. These results are robust across all supply-side models we estimated and remain robust after controlling for firm innovation.
Second, LBD greatly amplifies the sales impact of EV subsidies through a positive feedback loop. As shown in Figure 3, in the absence of LBD, subsidies across different countries are estimated to increase cumulative global EV sales by 29.9% during the sample period, consistent with findings in existing studies (Springel, 2019; Li et al., 2021) that focus on the short-term effects of EV purchase subsidies. When both consumer subsidies and LBD were in effect, global EV sales surged by 170% relative to the baseline with neither subsidies nor LBD. This combined effect is 60% greater than the sum of the effects from subsidies and LBD individually, highlighting their complementarity. Ignoring LBD would lead to a substantial underestimation of the long-term benefits of incentive policies.
Third, consumer subsidies in one country generate global spillovers through LBD in battery production. But the magnitude of spillovers critically hinges on the nature of the supply chain network. For example, the estimated $13.10 billion in US subsidies generated $16.47 billion in global welfare gains.1 The US and Canada captured 49% of these welfare gains, while US subsidies also benefited battery suppliers in Japan and South Korea, which captured 28% of the global welfare gains. Europe also benefited significantly from US subsidies; in contrast, China captured only 3% of the global gains. This modest share reflects China’s limited trade in EVs and EV batteries with foreign countries during our sample period.
Figure 3: Effect of Subsidies and LBD on Global EV Sales

Notes: This figure illustrates total EV sales across the top 13 EV countries under various scenarios. The solid black line represents observed EV sales with both LBD and consumer subsidies in effect. The dashed green line shows EV sales with LBD but no subsidies, while the dash-dot orange line represents EV sales with subsidies but no LBD. The dotted blue line shows EV sales with neither LBD nor subsidies. LBD greatly amplifies the sales-expansion effect of subsidies.
In a similar manner, European governments invested $16.44 billion in EV purchase subsidies, resulting in $11.60 billion in global welfare gains, of which only 26% were captured by the EU. This relatively low capture rate is driven by Europe’s higher import share of EVs and the widespread use of uniform subsidies, the latter of which are less effective in generating consumer surplus compared to the battery capacity-based subsidies in the U.S. (Barwick, Kwon, and Li, 2024). In contrast, China captured 92.6% of the global welfare gains from its subsidies due to China’s limited EV imports and the fact that the majority of its EV producers source batteries domestically.
Fourth, preferential treatments of domestic battery producers restrict the positive spillover across countries and incur costs to other countries and domestic consumers. China’s whitelist policy benefited domestic battery suppliers at a cost to other countries. The EU, Japan and South Korea, and the US and Canada collectively incurred $5.88 billion in welfare losses. This was driven by a shift in global battery production from more efficient Japanese and South Korean battery suppliers to (at the time) higher-cost Chinese suppliers. Within China, while battery suppliers reaped gains, consumers bore the burden of higher EV prices. China’s whitelist was introduced at a strategically favorable time when the learning curve was steep. Had the whitelist been delayed to 2021–2024, China would have faced net losses, with consumer welfare losses outweighing battery suppliers’ gains.
Lastly, upstream LBD creates significant externalities through the supply chain, with upstream firms capturing only a small fraction of the associated economic benefits due to the oligopolistic nature of the supply chain. Our simulations indicate that CATL, the leading battery supplier in China, captures 22.0% of the total surplus generated by its increased LBD, while Panasonic, the largest battery supplier in Japan, captures 21.7%. These findings suggest that the privately chosen experience level (and the degree of LBD) is unlikely to be socially optimal, and government subsidies have the potential to address the underprovision of LBD.
1The welfare is measured as the sum of consumer surplus and firm profit on a global scale, net of subsidy expenditure.
References
Argote, Linda and Dennis Epple. 1990. “Learning Curves in Manufacturing.” Science 247 (4945):920–924.
Barwick, Panle Jia, Hyuk-Soo Kwon, and Shanjun Li. 2024. “Attribute-based Subsidies and Market Power: an Application to Electric Vehicles.” Working Paper 32264, National Bureau of Economic Research.
Bloomberg NEF. 2023. “BloombergNEF Annual Battery Price Survey.” Https://about.bnef.com/blog/lithium-ion-battery-pack-prices-hit-record-low-of-139-kwh/.
Covert, Thomas R. and Richard L. Sweeney. 2022. “Winds of Change: Estimating Learning by Doing without Cost or Input Data.” Working paper.
International Energy Agency. 2023. “Global EV Outlook 2023.” Https://www.iea.org/reports/global-ev- outlook-2023.
Irwin, Douglas A. and Peter J. Klenow. 1994. “Learning-by-Doing Spillovers in the Semiconductor Indus- try.” Journal of Political Economy 102 (6):1200–1227.
Li, Shanjun, Xianglei Zhu, Yiding Ma, Fan Zhang, and Hui Zhou. 2021. “The Role of Government in the Market for Electric Vehicles: Evidence from China.” Journal of Policy Analysis and Management .
Springel, Katalin. 2019. “Network Externality and Subsidy Structure in Two-Sided Markets: Evidence from Electric Vehicle Incentives.” American Economic Journal: Economic Policy 13 (4):393–432.
Ziegler, Micah S. and Jessica E. Trancik. 2021. “Re-examining rates of lithium-ion battery technology improvement and cost decline.” Energy & Environmental Science 14:1635–1651.

Latest
Most Popular
- VoxChina Covid-19 Forum (Second Edition): China’s Post-Lockdown Economic Recovery VoxChina, Apr 18, 2020
- China’s Joint Venture Policy and the International Transfer of Technology Kun Jiang, Wolfgang Keller, Larry D. Qiu, William Ridley, Feb 06, 2019
- China’s Great Housing Boom Kaiji Chen, Yi Wen, Oct 11, 2017
- Wealth Redistribution in the Chinese Stock Market: the Role of Bubbles and Crashes Li An, Jiangze Bian, Dong Lou, Donghui Shi, Jul 01, 2020
- The Dark Side of the Chinese Fiscal Stimulus: Evidence from Local Government Debt Yi Huang, Marco Pagano, Ugo Panizza, Jun 28, 2017
- What Is Special about China’s Housing Boom? Edward L. Glaeser, Wei Huang, Yueran Ma, Andrei Shleifer, Jun 20, 2017
- Privatization and Productivity in China Yuyu Chen, Mitsuru Igami, Masayuki Sawada, Mo Xiao, Jan 31, 2018
- How did China Move Up the Global Value Chains? Hiau Looi Kee, Heiwai Tang, Aug 30, 2017
- Evaluating Risk across Chinese Housing Markets Yongheng Deng, Joseph Gyourko, Jing Wu, Aug 02, 2017
- China’s Shadow Banking Sector: Wealth Management Products and Issuing Banks Viral V. Acharya, Jun Qian, Zhishu Yang, Aug 09, 2017


