Rise of Bank Competition: Evidence from Banking Deregulation in China
This paper documents a novel trade-off of banking deregulation in the context of China by using loan-level big data. We find that following a deregulation in the form of geographically lowered bank entry barriers, the potential benefits such as the lower interest rates for borrowers were mitigated adversely by the worsening credit allocation. The soft budget constraint of SOEs, with implicit government guarantees, makes new entrant banks prefer inefficient SOEs to contemporaneously-opaque local private firms.

China’s banking system has been under reform since the 1980s as part of the economic opening policies initiated by Deng Xiaoping. The total assets of banks in China reached RMB 268.2 trillion in 2018, and many Chinese banks are among the biggest financial institutions worldwide (See Note 1). Despite the reforms over the past 30-plus years, the banking sector in China is still heavily regulated and inefficient (e.g., Song and Xiong (2018)). For example, the ”Big Five” state-owned commercial banks dominate China’s banking market with approximately 45% of the total lending business. Smaller banks, such as twelve joint equity banks, cannot fairly compete with the big five in many ways. A central question in academia and policy debates is whether banking deregulation and the subsequent increased competition would be desirable.
We study the impacts of the 2009 partial bank entry deregulation on the local industrial organization of banks and consequent economic activities by using comprehensive loan-level data on the seventeen largest commercial banks in China for 2006 to 2013 (See Note 2). Specifically, in 2006, the CBRC announced that the twelve joint equity banks, along with local commercial banks, could only apply to open one branch in one city at a time (See Note 3). This bank entry barrier severely restricted the expansion of joint equity banks. For example, at the end of 2008, the Big Five bank branches covered approximately 85% of Chinese cities (293 out of 345 cities), while the twelve joint equity banks covered only approximately 9.5% of cities (33 out of 345 cities).
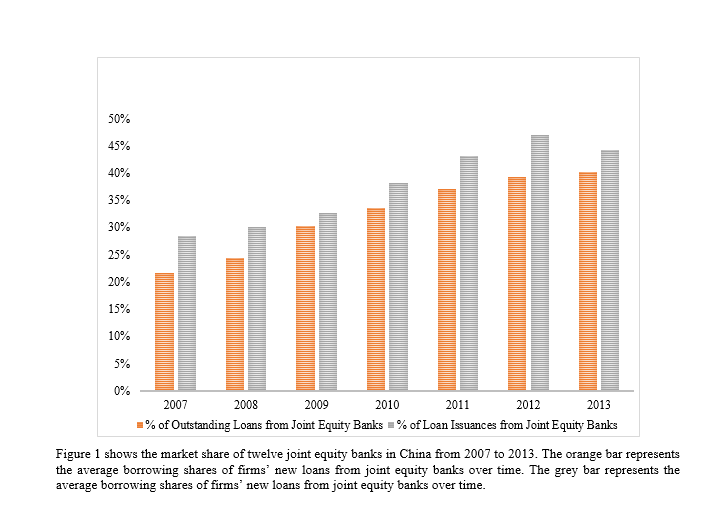
In April 2009, the CBRC announced a plan to partially remove the bank entry barrier. This deregulation aimed to increase the competition in China’s banking system by allowing joint equity banksto freely open branches in a city in which they had already established branches. Joint equity banks were also allowed to freely enter all cities in a province when they operated branches in this province’s capital city. (See Note 3) Figure 1 shows that the market share of joint equity banks has been increasing significantly following the 2009 deregulation.

The exogenous variation in deregulation is cross bank-city and over time. In the same city, different equity banks can have different exposures to deregulation, depending on their ex-ante branch distributions. This partial deregulation offers a standard Difference-in-Differences (DID) empirical setting. In particular, banks in cities in which no equity banks have been allowed to expand are mostly immune to the deregulation shock and can serve as the control group. The DID regressions show that consistent with the unconditional pattern in Figure 1, the lending amount of joint equity banks increases by 31.2% in deregulated cities flowing deregulation, as anticipated. Following deregulation, the impact of this expansion was filtered through and altered the local industrial organization of banks, and the potential benefits were adversely mitigated by a preference for lending to state-owned enterprises (SOEs) over more productive private firms.
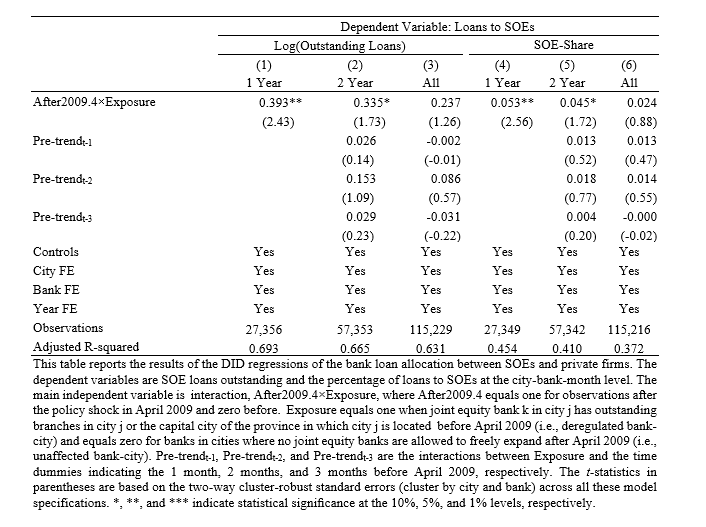
More specifically, the soft budget constraint of SOEs, with implicit government guarantees, makes new-entrant banks prefer inefficient SOEs to contemporaneously opaque local private firms. Table 1 shows that within one year after deregulation, joint equity banks’ SOE loans outstanding and shares of SOE loans made in deregulated cities increased by 39.3% and 5.3%, respectively. This pattern weakens in the two-year window following deregulation (i.e., 33.5%, and 4.5% increases in SOE loan amounts and shares), and becomes insignificant in the three-year window. Furthermore, we use the monthly internal ratings of each loan in the sample to measure banks’ information on borrowers; i.e., banks’ ability to downgrade the internal loan ratings before delinquency. We find that banks can predict approximately 22.6% of the delinquency events within two years after branch opening and this ratio increases to 42.3% after the third year. This suggests that new-entrant banks indeed lack sufficient information on local borrowers in the beginning but accumulate more information over time. In the longer run, new-entrant banks learned about local private firms’ characteristics and lent more to them. However, as we attempt to quantify, the sizable amount of money lent to SOEs in new markets was “lost.” Overall, the total amount of credit misallocation to SOEs following the deregulation is approximately RMB 684 billion, equivalent to 2 percent of China’s 2008 GDP.

Other than this loss, deregulation provided immediate benefits. For private firms that did get funding, the new-entrant banks required more guarantees and higher internal loan ratings as indicators of quality. Also, the on-lending interest rates in deregulated cities decreased by 6.6% following deregulation. Consequently, following deregulation, the private firms in deregulated cities saw in increase of 21.3% and 8.1% in the growth of fixed assets and employees, respectively. Moreover, the profitability of those private firms also improved, with increases of 44.0% and 1.8% in net income growth and ROA, respectively. In contrast, the growth and profitability of SOEs barely change following deregulation.
In summary, we document a new finding that deregulation leads to lending to inefficient SOEs. This worse credit allocation is primarily attributable to SOE’s soft budget constraints and serves as a novel and nontrivial cost of banking deregulation in China. This unintended adverse consequence has board implications beyond China. The core of the first- and second-welfare theorem is that market competition can beneficial, but under the theory of second-best, this might not be the case when market frictions are present. Fixing one friction, e.g., bank entry restrictions, can introduce unintended adverse effects arising from other frictions, e.g., the soft budget constraints of SOEs (Qian and Roland (1998)). Our results suggest that policymakers should consider the interaction of different frictions in reform policies and governments should optimally sequence reforms to minimize risks and maximize benefits.
Note 1: The "Big Five" state-owned commercial banks in China are the Industrial & Commercial Bank of China (ICBC), the China Construction Bank (CCB), the Agricultural Bank of China (ABC), the Bank of China (BOC), and the Bank of Communications (BoCom). The ICBC is the largest bank in China, with assets of RMB 27.7 trillion (USD 4.1 trillion) in 2018. The largest bank in the United States is JPMorgan Chase with USD 2.6 trillion total assets. The information is from Bankscope.
Note 2: The data record the detailed contract terms such as borrower and lender identifications (IDs) and loan contract terms. We match the loan data to the Chinese Industry Census by firm IDs. This allows us to trace each loan a firm borrowed and study how firms react following deregulation.
Note 3: Please refer to CBRC Order [2006] No.2, titled, “The implementation of administrative licensing items on Chinese commercial banks.”
(Haoyu Gao, Central University of Finance
and Economics; Hong Ru, Nanyang Technological University; Robert M.
Townsend, MIT, Department of Economics; Xiaoguang Yang, Chinese Academy
of Sciences.)
References
Song, Z., and Xiong, W., 2018. Risks in China’s financial system. Annual Review of Financial Economics 10, 261-286.
Latest
Most Popular
- VoxChina Covid-19 Forum (Second Edition): China’s Post-Lockdown Economic Recovery VoxChina, Apr 18, 2020
- China’s Joint Venture Policy and the International Transfer of Technology Kun Jiang, Wolfgang Keller, Larry D. Qiu, William Ridley, Feb 06, 2019
- China’s Great Housing Boom Kaiji Chen, Yi Wen, Oct 11, 2017
- Wealth Redistribution in the Chinese Stock Market: the Role of Bubbles and Crashes Li An, Jiangze Bian, Dong Lou, Donghui Shi, Jul 01, 2020
- The Dark Side of the Chinese Fiscal Stimulus: Evidence from Local Government Debt Yi Huang, Marco Pagano, Ugo Panizza, Jun 28, 2017
- What Is Special about China’s Housing Boom? Edward L. Glaeser, Wei Huang, Yueran Ma, Andrei Shleifer, Jun 20, 2017
- Privatization and Productivity in China Yuyu Chen, Mitsuru Igami, Masayuki Sawada, Mo Xiao, Jan 31, 2018
- How did China Move Up the Global Value Chains? Hiau Looi Kee, Heiwai Tang, Aug 30, 2017
- Evaluating Risk across Chinese Housing Markets Yongheng Deng, Joseph Gyourko, Jing Wu, Aug 02, 2017
- China’s Shadow Banking Sector: Wealth Management Products and Issuing Banks Viral V. Acharya, Jun Qian, Zhishu Yang, Aug 09, 2017


 Facebook
  Twitter
  Instagram
 WeChat
  Email
Email 


